How To Use Amazon CodeGuru Profiler To See What Your Application Is Doing
Amazon CodeGuru includes an always-on profiling service which can provide insights into your application - this post will showcase how you can get started with CodeGuru Profiler, and the kind of information you can extract from it. Please note that I do work for AWS on CodeGuru Profiler but everything contained in this post is my own opinion - I am not speaking on behalf of Amazon or AWS in any official capacity.
Getting Started
Setting Up An IAM User
CodeGuru Profiler works by running a small agent inside your application (in this case the JVM) which occasionally submits data to the CodeGuru back-end service. So first we need to set up some access credentials so our application can get permission to submit data to my account.To do this I created a new IAM user and gave it permission to submit to any profiling group in my own account. Below is the IAM policy attached to the user:
{
    "Version": "2012-10-17",
    "Statement": [
        {
            "Effect": "Allow",
            "Action": [
                "codeguru-profiler:ConfigureAgent",
                "codeguru-profiler:PostAgentProfile"
            ],
            "Resource": "arn:aws:codeguru-profiler:*:<redacted account ID>:profilingGroup/*"
        }
    ]
}
I then created an access key for the IAM user, which I can provide to my application code via program arguments or environment variables since I'm just running this application from my MacBook. In a production service, you would likely want to do this via IAM roles instead of IAM users.
Creating A Profiling Group
Profiling groups are CodeGuru Profiler's way of grouping different profile submissions together. If you're running multiple instances of your application, say on multiple hosts behind a load balancer, then you'd want to use a single profiling group across all the hosts so you can view aggregated data across all the hosts.
If you have a dev/staging/beta/gamma environment then you'd want to use a separate profiling group for each stage, since these stages often have different runtime behavior than your production environment (e.g. less traffic, test data, etc).
To create a profiling group, I navigated on the console to https://console.aws.amazon.com/codeguru/profiler/search and clicked "Create profiling group". In this case, I called it "Isaac-GitHubIssueLister-Dev" to indicate which application and which stage will be reporting profiles to this group.
Integrating With Your Application
Next up is to modify our application's code to start the profiler on start-up, with the right profiling group and region. I added the following code to the start of my application's main method:
Profiler codeGuruProfiler = new Profiler.Builder()
    .profilingGroupName("Isaac-GitHubIssueLister-Dev")
    .awsCredentialsProvider(StaticCredentialsProvider.create(AwsBasicCredentials.create(awsAccessKeyId, awsSecretAccessKey)))
    .awsRegionToReportTo(Region.EU_WEST_1)
    .build();
codeGuruProfiler.start();
You'll notice I provide my profilingGroupName, an AWS credentials provider (just an access/secret key pair in my case), and the AWS region my profiling group exists in. Once `codeGuruProfiler.start()` runs an async thread will start up which profiles the application until the JVM stops or `codeGuruProfiler.stop()` is called.
Let's Start Profiling!
Logs
Now when I start up my Java application I see these logs on start-up related to CodeGuru Profiler:
Dec 08, 2019 12:11:30 PM software.amazon.codeguruprofilerjavaagent.Profiler start
INFO: Starting the profiler : Profiler{profilingGroupName=Isaac-GitHubIssueLister-Dev, agentMetadata=AgentMetadata{fleetInfo=FleetInstance{id=9cac2a41-d222-4003-ba5d-83a8c55328d1, type=UNKNOWN, costPerSecond=null, vCPUs=null}}, isRunning=false, isProfiling=false}
Dec 08, 2019 12:11:30 PM software.amazon.codeguruprofilerjavaagent.ProfilingCommand start
INFO: Profiling scheduled, sampling rate is PT1S
And after around 5 minutes of profiling, the data is submitted to the back-end:
Dec 06, 2019 8:06:13 PM software.amazon.codeguruprofilerjavaagent.ProfilingCommand reportProfile
INFO: Attempting to report profile data: start=2019-12-06T20:01:12.578Z end=2019-12-06T20:06:13.535Z force=false memoryRefresh=false numberOfTimesSampled=301
Dec 06, 2019 8:06:13 PM software.amazon.codeguruprofilerjavaagent.ProfilingCommand submitProfilingData
INFO: Successfully reported profile
From this, we can deduce that CodeGuru Profiler sampled my application 301 times in the 5 minute period between 20:01:12 and 20:06:13, and successfully submitted the data.
Visualising The Data
Around 10 minutes after my first submission, I see my profiling group turn to "active", and I can view a flame graph!
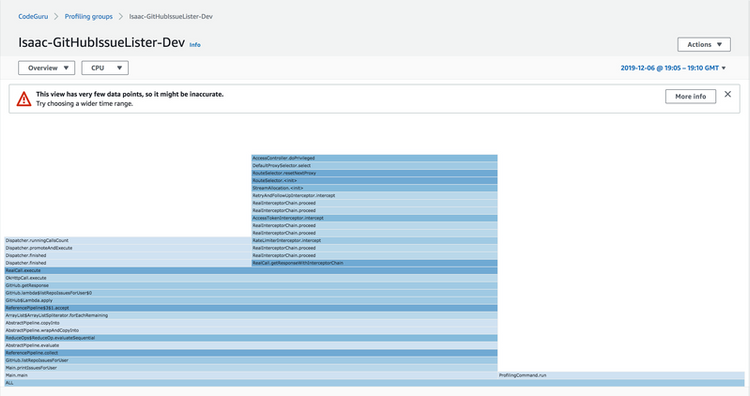
As you may notice, we have a warning about the lack of data points. This comes about because of several reasons: it was only 5 minutes of data, I only have one instance of my application running, and I only have a single thread in my application (in addition to the profiling thread).
After running my application for a couple of hours more at various points over a couple of days, and extending the date range to include all of these days I get a flame group that gives me a little more insight.
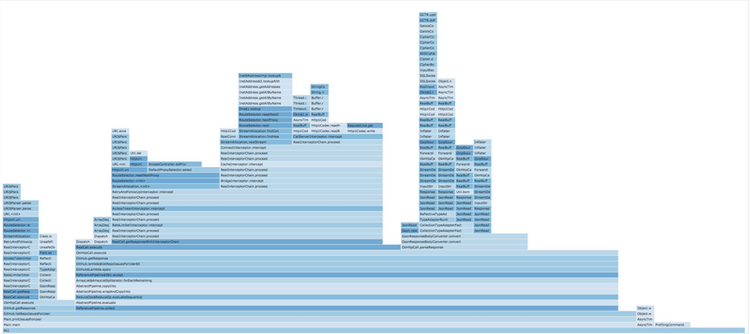
At first glance, this can be a little hard to understand - but equipped with some knowledge about what your application does it can be a powerful tool. Let me explain a little about the application I'm profiling.
Understanding the Application
My profiled application runs the following in a loop:
- List all GitHub repositories owned by the given GitHub user
- For each repository: list all issues in the repository
- Print all issues
- Sleep for 1 second
The source code is available here: https://github.com/Sheepzez/CodeGuruProfilerQuickExample.
For all the GitHub API operations, it uses an `okhttp3.Interceptor` to rate-limit API calls (using a Guava ratelimiter) and add a GitHub auth token for higher call limits. There's also some Lombok thrown in to simplify boilerplate (constructors and toStrings), and the main method contains the code mentioned above to start the CodeGuru profiler.
Knowing this information, we can start to piece together where the application spends its time by looking at the flame graph.
Putting It All Together
In the below image, I've zoomed in on the method (GitHub.listRepoIssuesForUser) which first lists all repositories for a user, then uses that list to fetch issues for each repository.
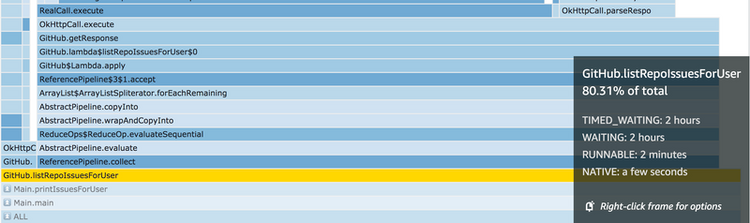
You might be able to see this method has two stacks of frames coming out, a skinny stack on the far left and a wide stack taking up most of the image. This gives us a visual indication of how much relative time each of the calls inside GitHub.listRepoIssuesForUser takes up.
The skinny stack on the left represents the time taken to process requests for the "list repositories" call, and the wide stack on the right-hand side represents the time taken for "list issues in repository". This makes sense since we call "list issues in repository" for each repository, and "list repositories" only once for each GitHub user.
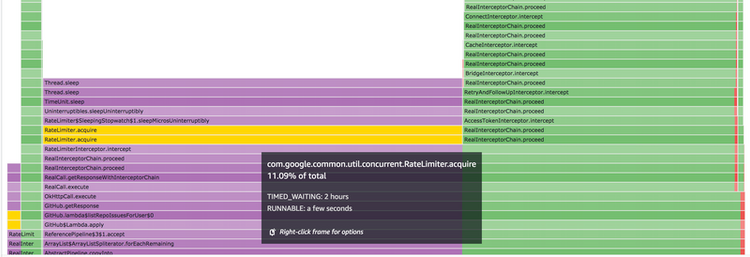
This view doesn't quite give us the full picture though. If I flip into "Latency" view I can see what state my thread was in most of the time:
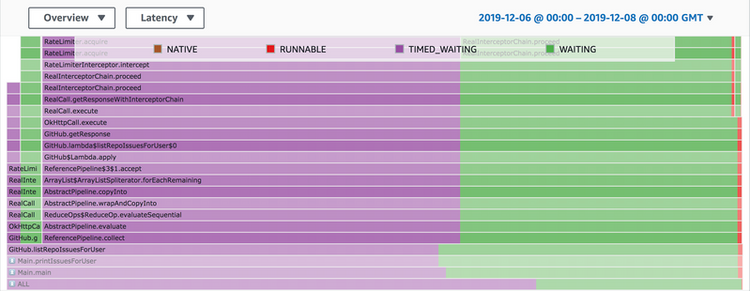
As the legend shows, purple and green are kinds of "waiting" and red is "runnable". Runnable (red) is the most interesting in many applications since threads in that state are actively executing code, instead of waiting for some kind of state change. That's why the default view in CodeGuru Profiler is "CPU" mode which is the best mode for finding code paths that are frequently called or slow running to execute. "Latency" mode, however, can give us insight into areas where we have threads waiting for disk IO, other threads (e.g. futures), or as in this case, network IO.
Scrolling up the stack a bit I can see which code path is causing the purple "timed waiting". In this case, it's the Guava RateLimiter I put in which limits my GitHub call rate so I don't exceed the API key limits. Were this a real application, I could optimise here by finding ways to increase my GitHub API rate limits or to cache requests so I don't need to make so many calls.
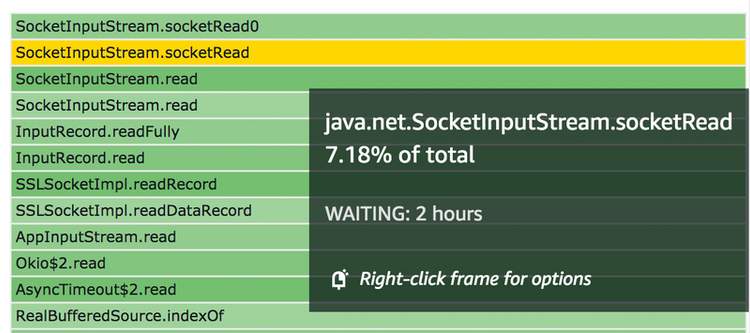
The green side of the image is actually waiting on the network response, which I can tell because the top frame is `java.net.SocketInputStream.socketRead`. The obvious way to optimise this might be to cache the requests, split them off into an async thread if there was other processing I could do, parallelise the requests, or try to reduce latency to the GitHub API (such as colocating).
Many real applications are likely to see a lot more frames with a lot more variety than in my sample application which can often take time and domain knowledge to understand, but it's frequently worth it - especially if you're looking to reduce hosting costs or latency.
Summary
I hope this was a useful post showing a little bit of the insights that CodeGuru Profiler can give you with relatively little work to integrate (especially if you're already running an application that uses the AWS SDK). There's lots more that CodeGuru Profiler can give you such as automatic optimisation recommendations, and different views to slice-and-dice your profiles (whether you're looking to reduce costs, increase throughput, on-board a new teammate, or understand an on-going operational issue) - but I'll leave those for future posts!
If there are any questions/comments please feel free to contact me! I do work for AWS on the CodeGuru Profiler team, so all feedback is more than welcome! Thanks for reading.
If you enjoyed this post, please check out my other blog posts.